10. July 2020
by Florian Lautenschlager | 1189 words | ~6 min read
diagnosibility devops observability collaborative monitoring logging tracing metrics
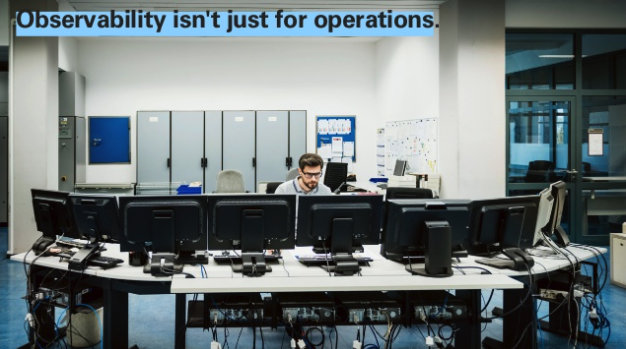
Fortunately, we were able to develop a new large project. In this project there are various different teams that use different programming languages and the expertise of different team members varies. We developed the backend that other developers, testers etc. use to call skills. Typically, a hardware client sends voice commands to the backend, which are processed and the requested skill is called (see Fig. 1).
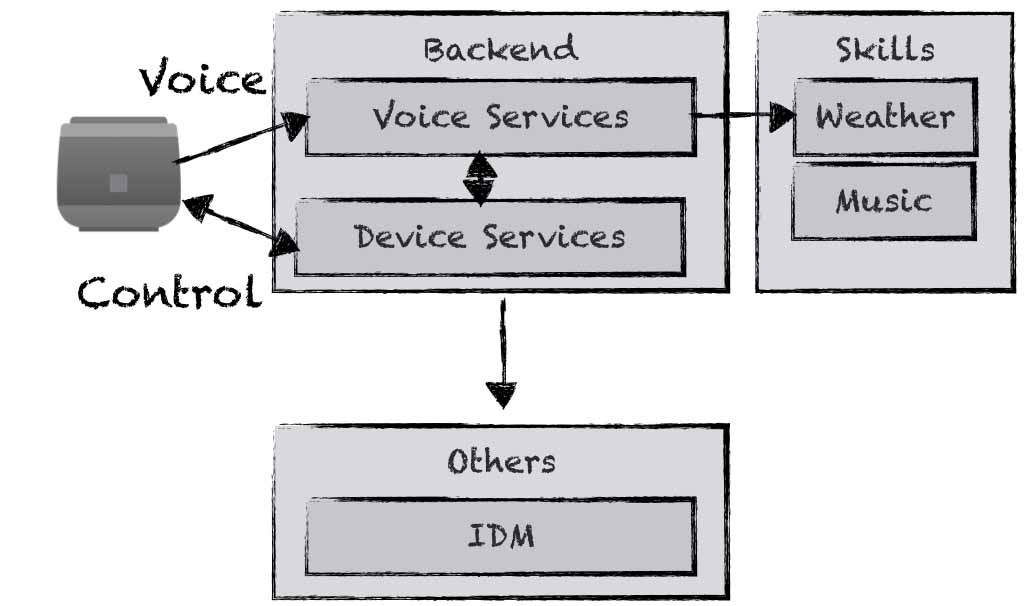
Figure 1: Overview of our application.
The software system is developed with a classical microservice architecture and cloud-native technologies. The backend is developed using Spring Boot, the skills using Python. Everything is packed into Docker containers and run within Kubernetes on Azure. To analyse this software system we instrumented our services and skills with Zipkin for distributed tracing and with Prometheus and Grafana for analysing metrics. Logs are written structured (JSON), collected with Fluentd, stored in Elasticsearch and analysed in Kibana.
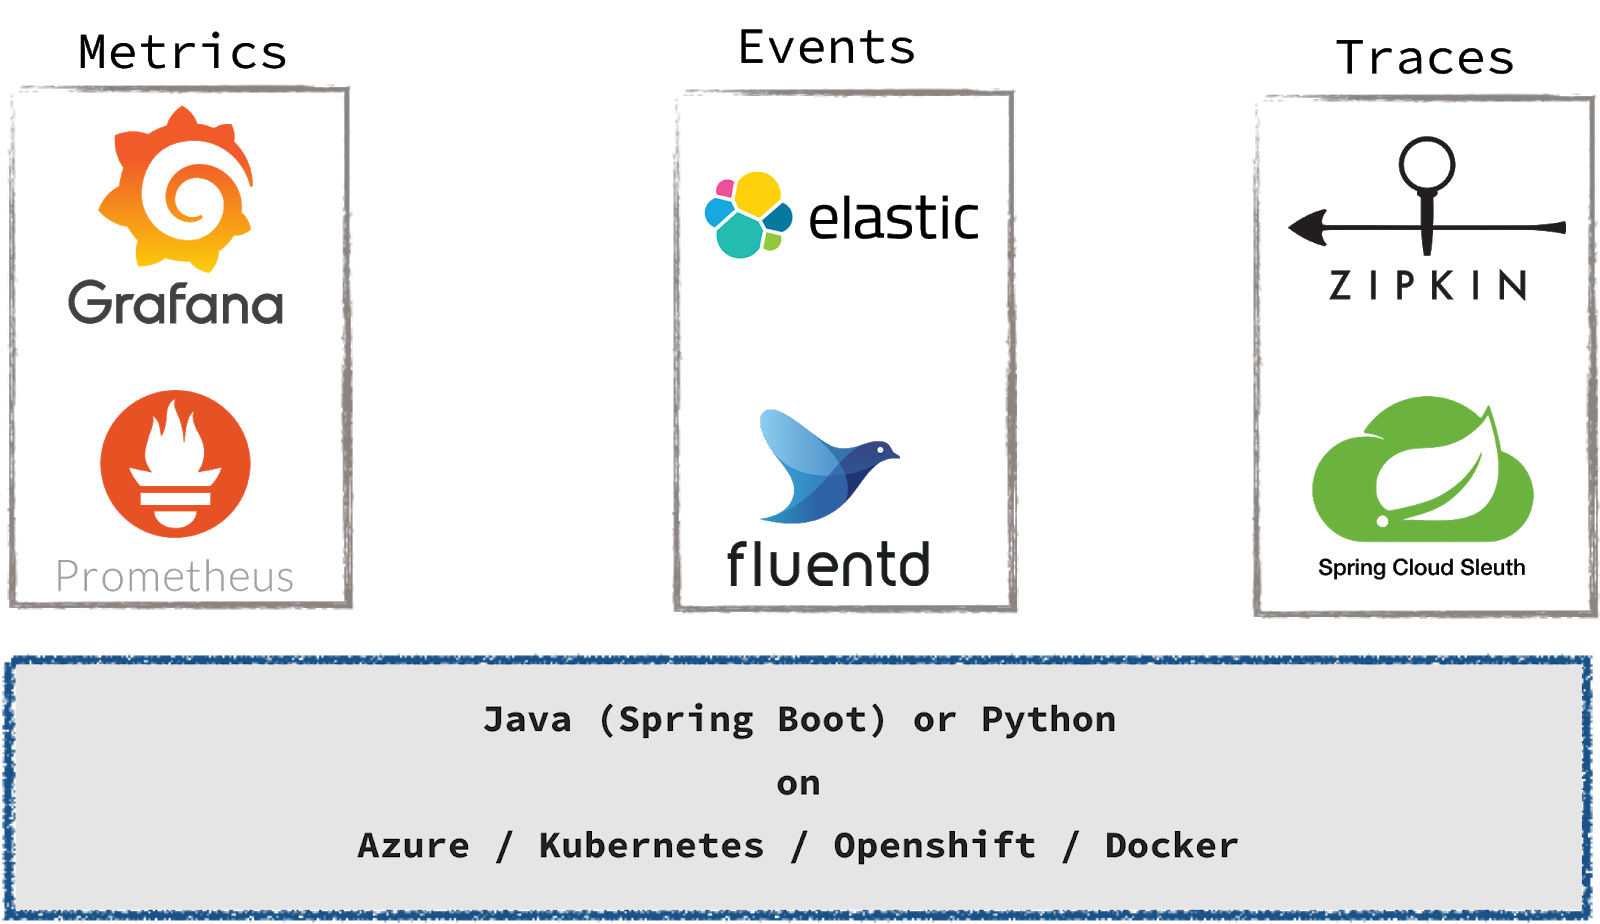
Figure 2: Toolchain for collecting metrics, events and traces.
Very early, people started asking what happend if a skill-invoke or -response might not work out. Although we already offer the above mentioned means, skill-developers, QA-Team etc. do not use the toolchain. After a while we came up with a three step approach, that we call collaborative monitoring (see Figure 3).
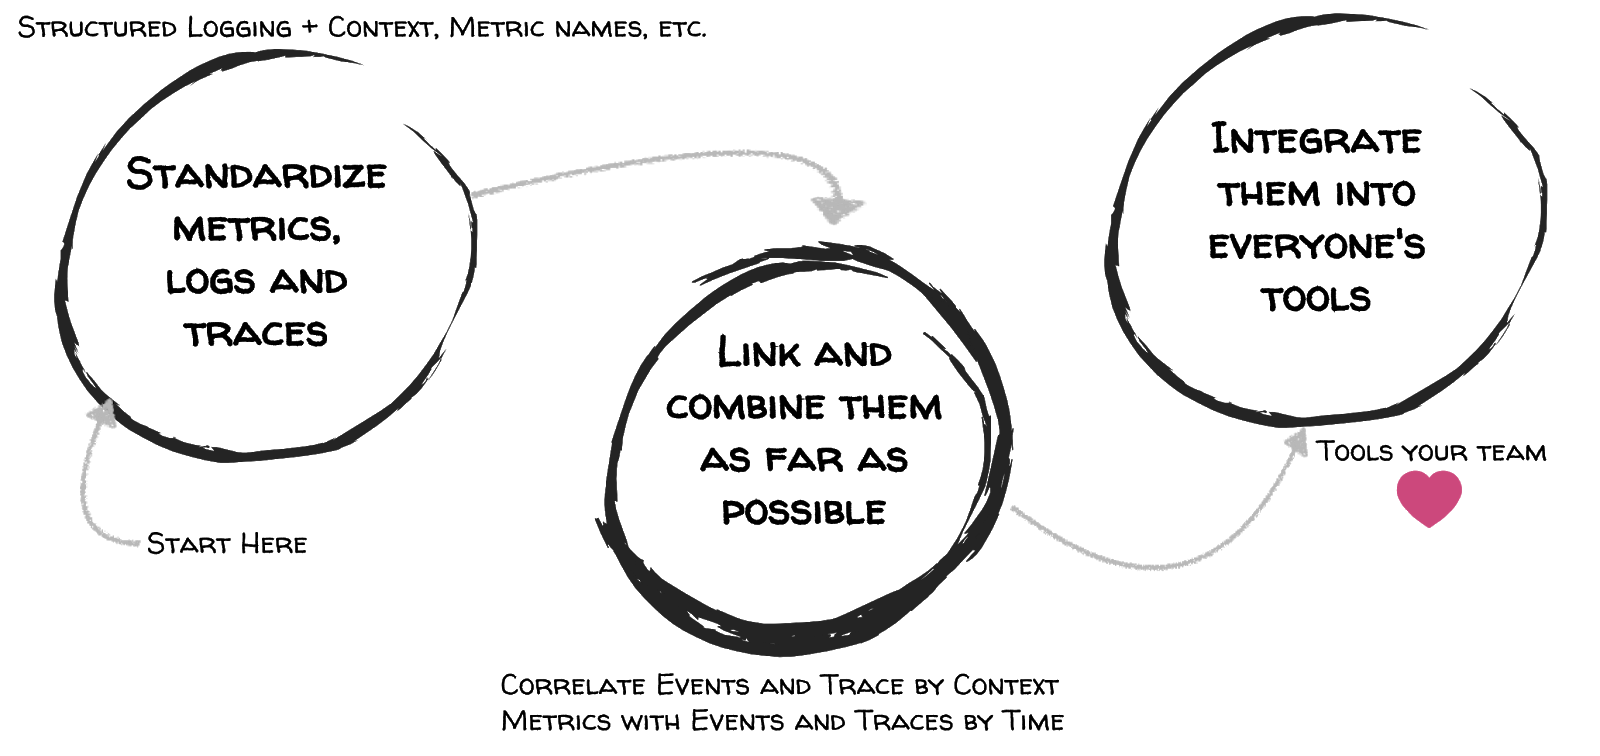
Figure 3: Three steps to enable Collaborative Monitoring
The first step (standardise metrics, logs and traces) ensures that the important and necessary information to understand the software systems behaviour is collected respecting certain guidelines. In the second step we combine the metrics, events (log-messages) and traces whereby the guidelines are an important basic building block. The third step integrates the tools to analyse the metrics (Prometheus + Grafana), events (Elasticsearch + Kibana) and traces (Zipkin-Server) in the daily tools developers or testers use, for example a chatbot.
We have observed that these three steps lead to intensive use of the tool chain, especially the last one. In the following we are going to describe these three steps.
To simplify the work with metrics, logs and traces we defined some guidelines, e.g. how to name metrics for outgoing calls, the minimal required fields in a log entry or how to name the tags of a span. This allows us to reuse dashboards and predefined queries for logs or traces. Furthermore, we could ensure that all the necessary information is gathered, like tenant label on outgoing and incoming calls as well as traceId and userId on logs. As an example, we introduced an annotation that developers must use if they want to collect metrics for database calls or to enrich the span information (see Listing 1).
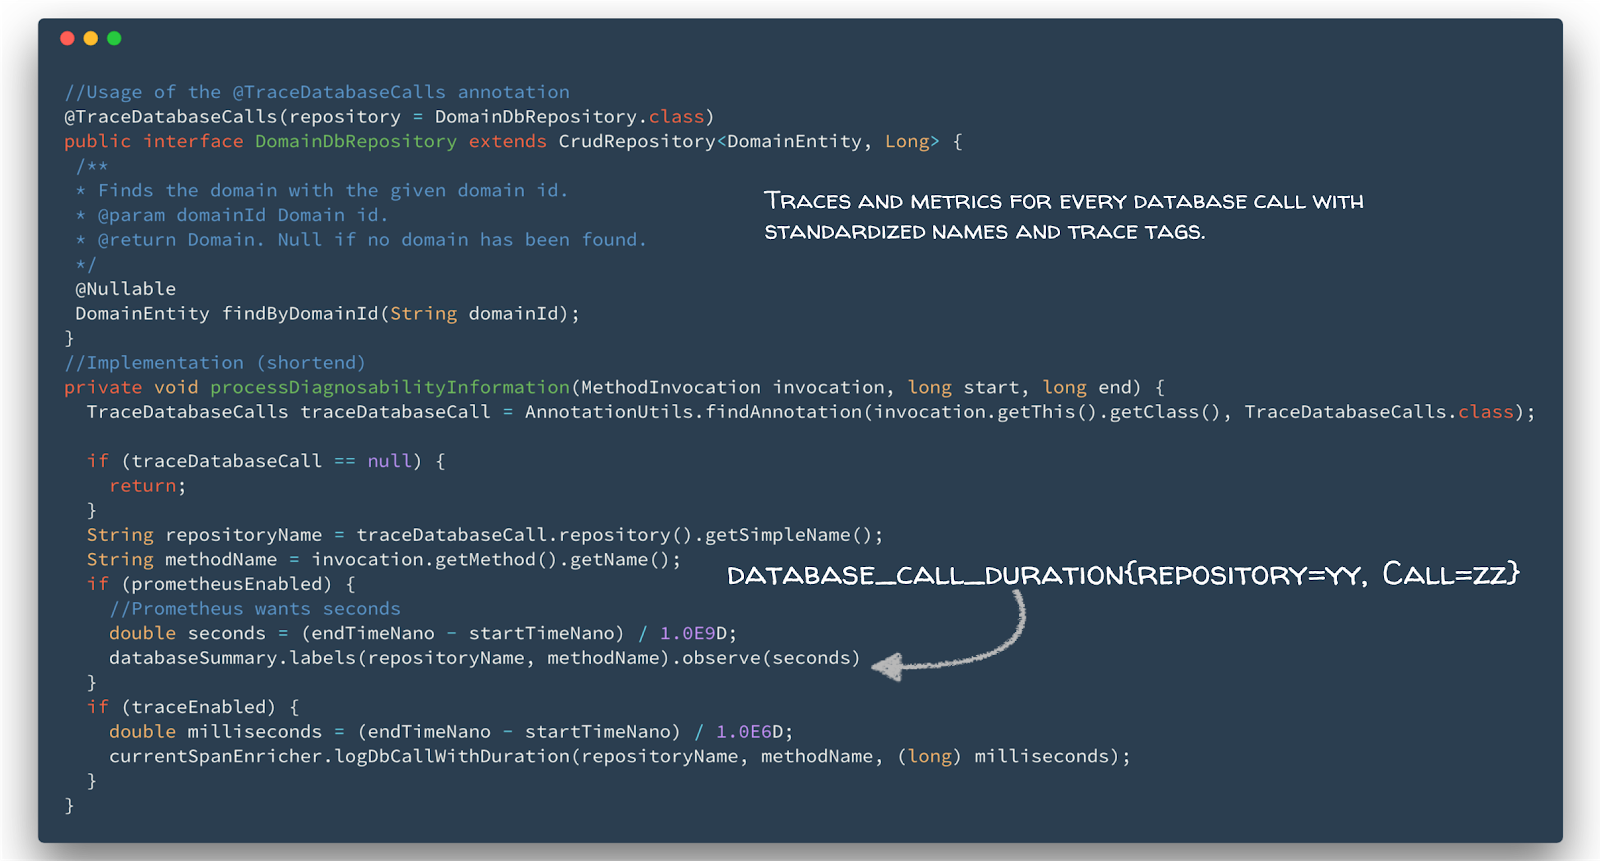
Listing 1: Annotation to collect database call durations and expose them as metric and span information.
In general, monitoring is either event- or sampling-based. Our toolchain collects metrics sampling-based (as the most other tools do). On the other hand, logs (events) and traces are collected based on events. Hence, we can not easily combine metrics (sampling-based) with traces and logs (event-based).
Combine Metrics with Traces and Logs (Events): One can combine them using the timeline. In order to do this, every metric, trace and log needs a timestamp indicating when it was gathered. Even if these timestamps are not aligned in time, we can combine them vaguely.
Combine Traces and Logs: One can combine traces and logs sharing the same context, e.g. the userId, tenant, traceId or spanId. This context is stored in the tags of a span and as fields in a log entry. Based on this, we can easily find all logs for a specific trace, using the traceId or all traces of a user by the userId (see also contextual logging). For example, we implemented an AbstracJsonProvider for logback that reads the context out of the mapped diagnostics context of the log-event. If present, it writes each context entry as JSON field (see Listing 2).
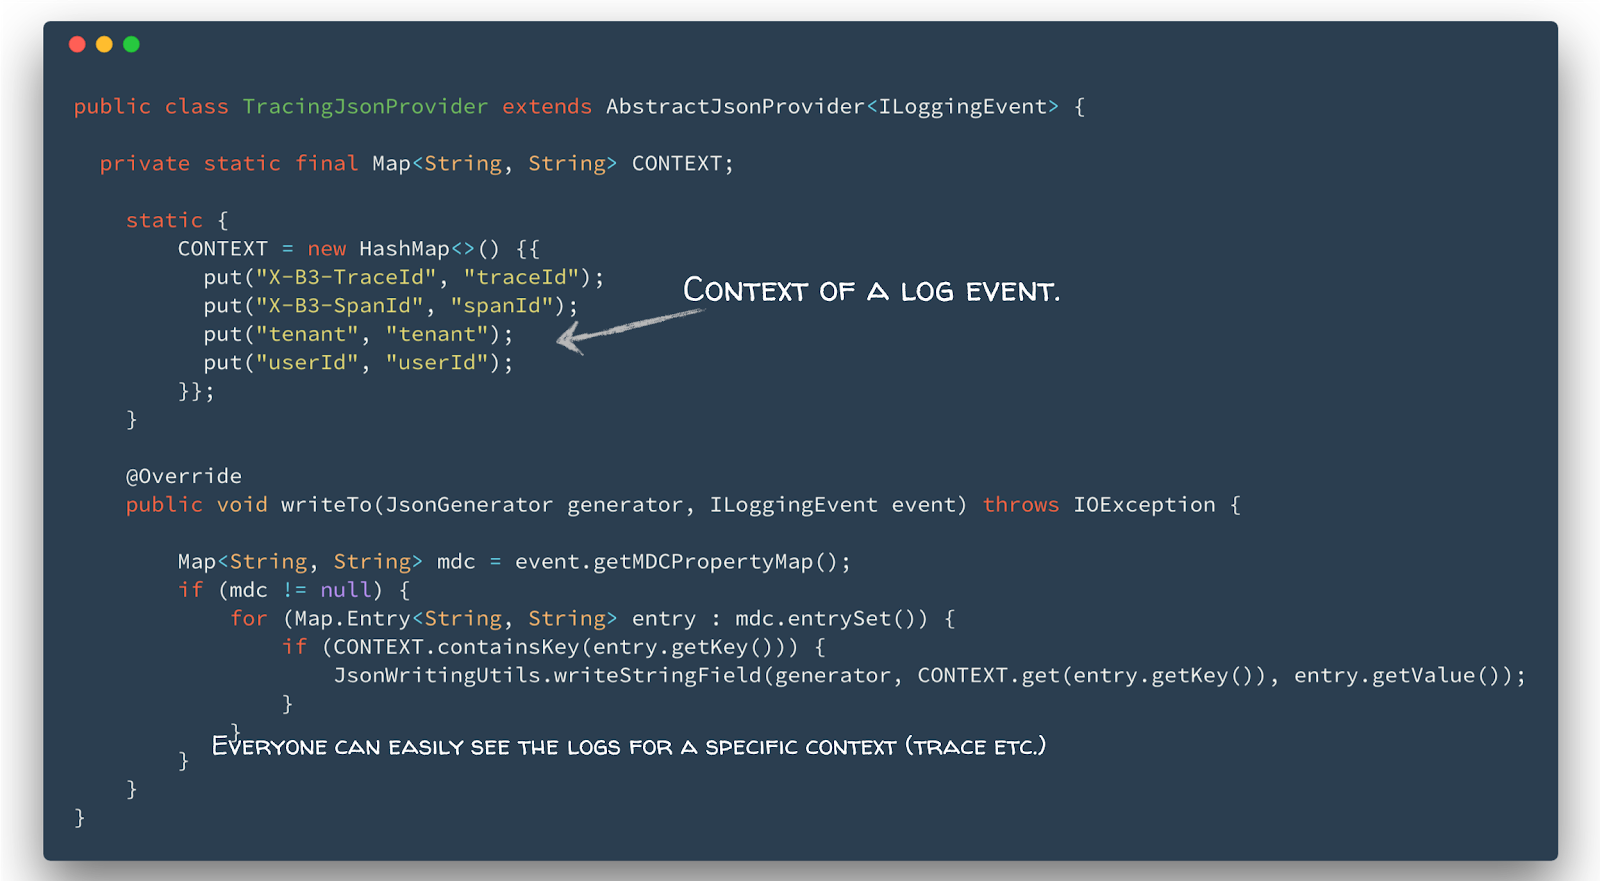
Listing 2: Contextual logging using a JSON provider for logback.
In the last step, which is very important, one has to integrate the toolchain into the tools everyone uses. In our example (without the integration) an ordinary developer can look into four different tools to analyse the data and still it’s not clear how to combine the information. Consequently, in nearly all cases an expert has to answer simple questions and becomes more and more first-level support for monitoring concerns.
In our case almost all teams use Mattermost for communication, e.g. to talk about problems, new features or just about the weather and a five minute workout. It was obvious to integrate the tool chain into Mattermost. We already had a chatbot to communicate with the application, e.g. to ask how the weather will be (what is the typical usage). Figure 4 shows an example.
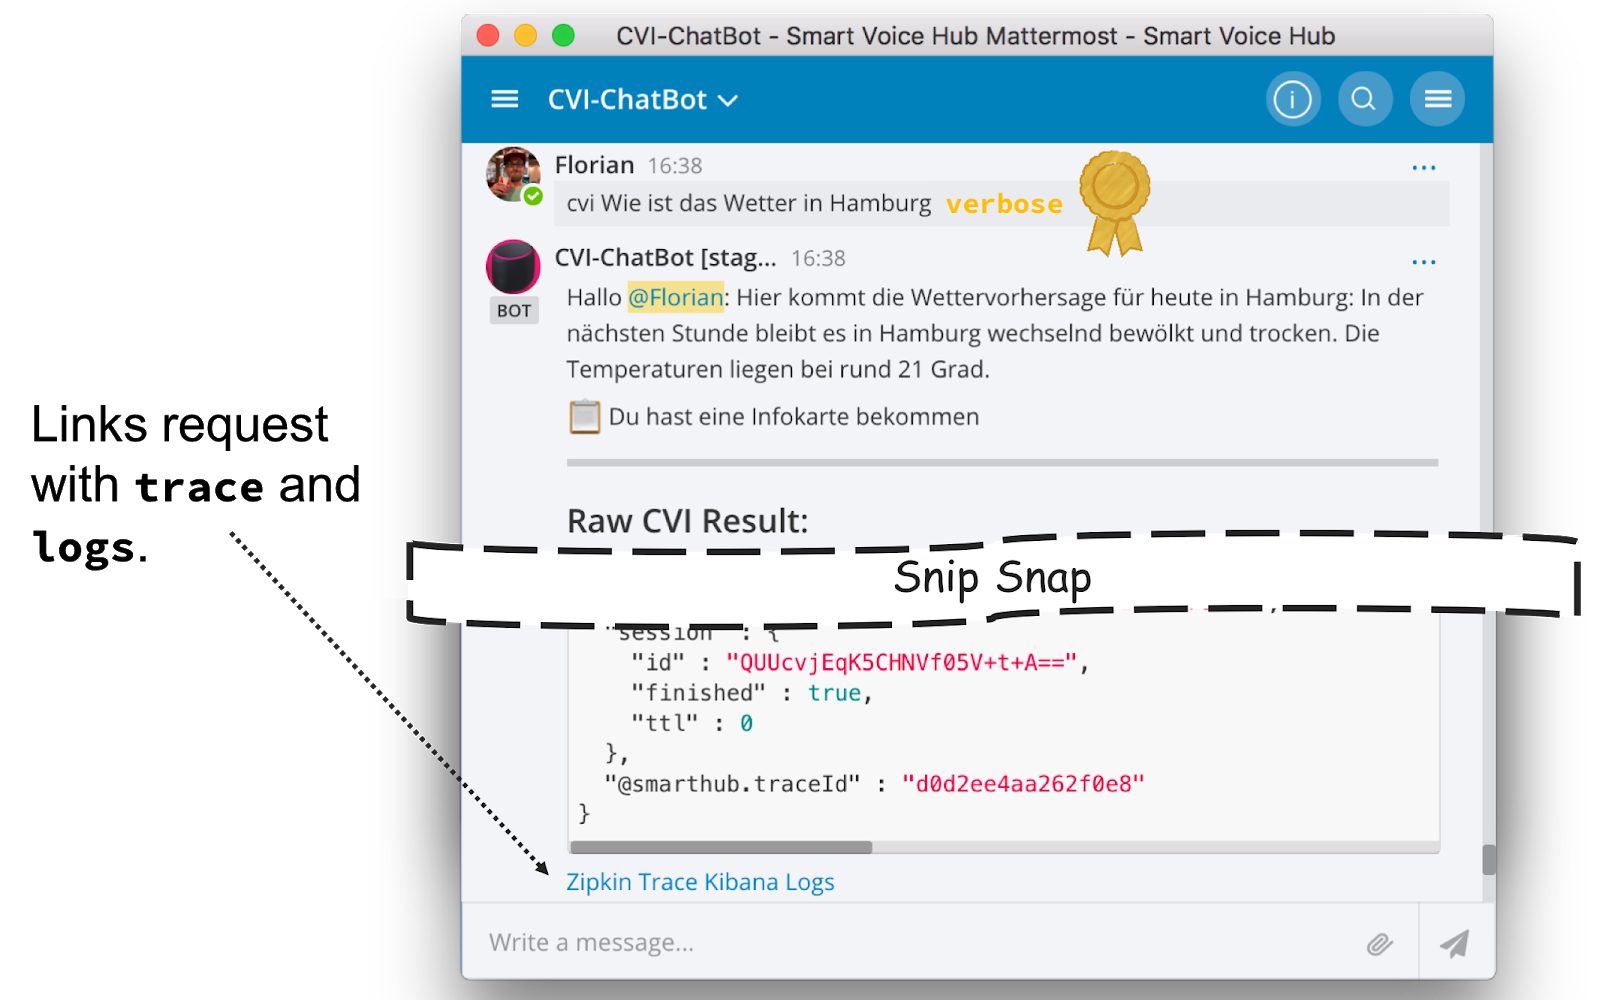
Figure 4: Chatbot to interact with the application, e.g. asking for the weather in Hamburg. With the special field verbose, the Chatbot also provides links to the trace and the logs of the specific request.
In case of an error or if the user provided the verbose flag, the Chatbot links the request to the collected trace and the logs. This is an easy integration that ordinary developers accept. Furthermore, they can analyse their problem on their own and feel like Superman =). We do not only integrate the traces and the logs, we also provide information about the health of the application in terms of health-checks and e2e test results, as the Figure 5 shows. The links in the response directly point into the Grafana dashboard. The latter links into the logs, where a developer can find the corresponding traceIds (see Figure 6).
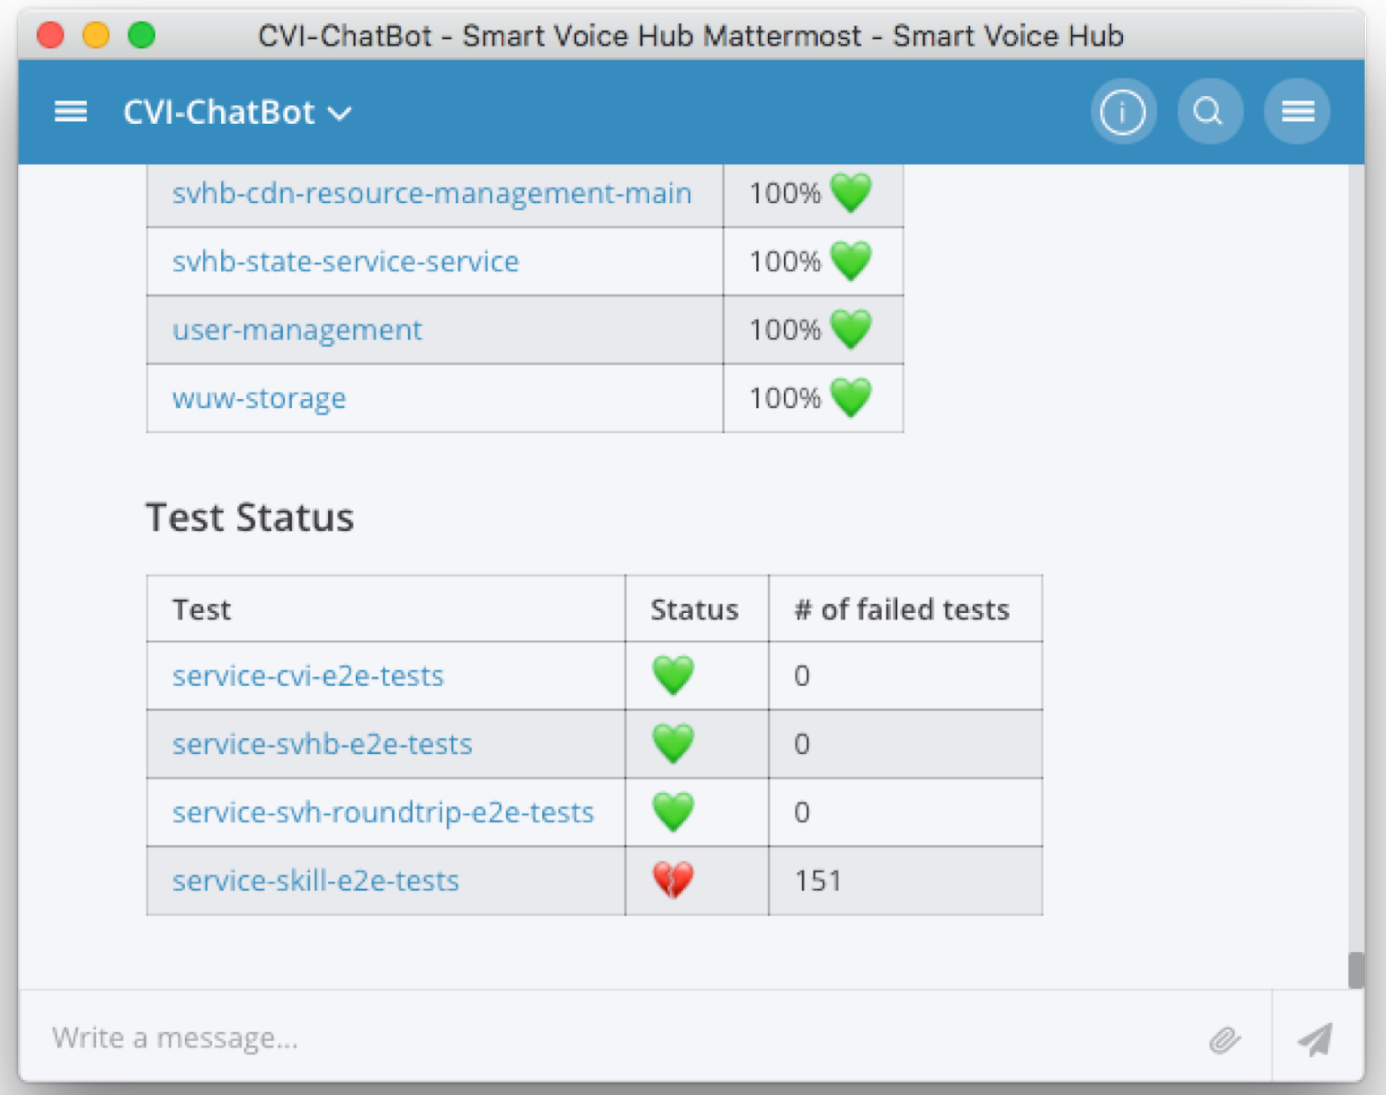
Figure 5: Integration of health-checks and e2e test result in the Chatbot.
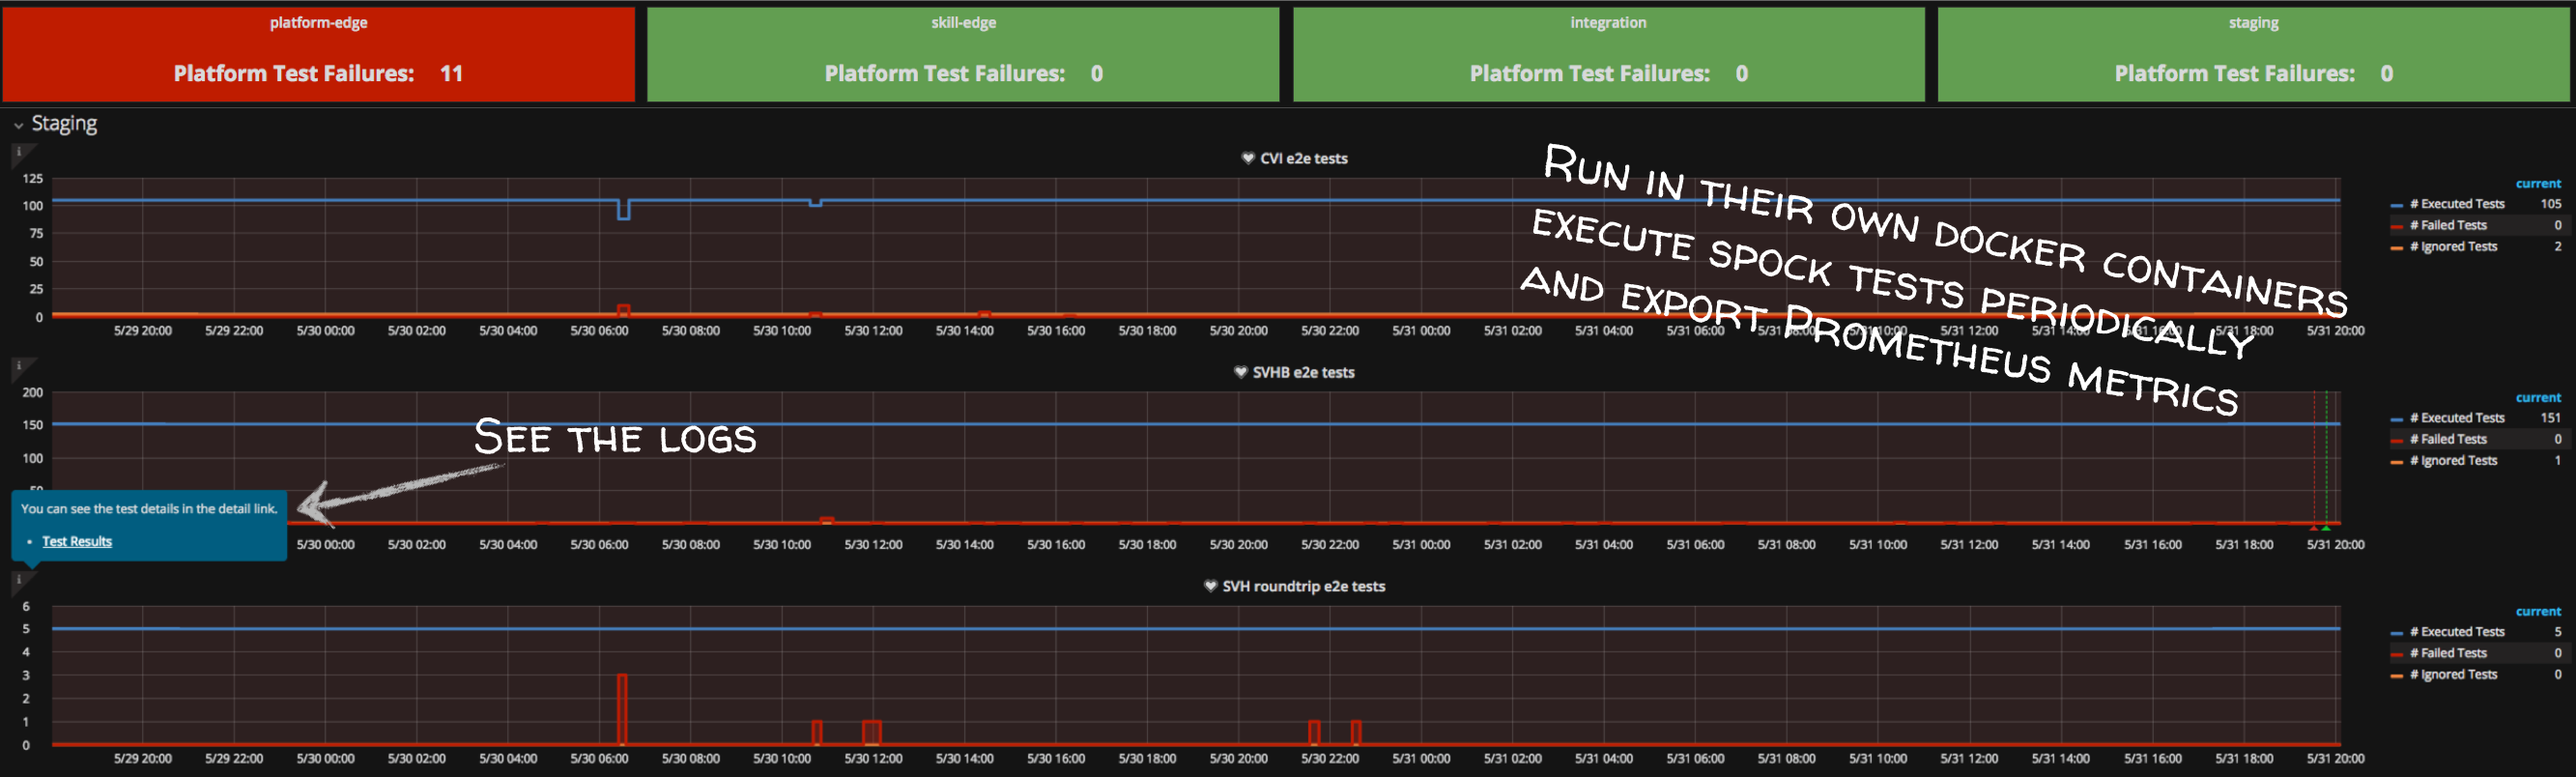
Figure 6: e2e test analysis in Grafana. A link jumps into the logs of the e2e test, where a developer can find the traceIds.
We found out that collaborative monitoring is a helpful mean for a better usage of our monitoring toolchain. The feedback within the project is really good and the operations team also wants to integrate the toolchain into their custom first-level support application. Furthermore, collaborative monitoring leads to a clear communication between different teams (backend / frontend developers) using the context, e.g. the traceId of an erroneous request. It is standard that ticket issuer always provide the traceId, with which the developers can easily understand the software systems behaviour in terms of logs and traces. They can also combine metrics with the requests by time.
In summary, we found the approach so good that we would like to share it with you. Hope you enjoyed!
Florian Lautenschlager and Josef Fuchshuber in cooperation with Robert Hoffmann.
We also presented these ideas at Container Days 2018. You will find our slides on slideshare: https://de.slideshare.net/QAware/observability-in-action-the-wild
Our talk @ Cloud Native Night Meetup
From Zero to Useless to Hero – Make Runtime Data Useful in Teams (Observability) von QAware GmbH