04. September 2023
by Sebastian Macke | 3509 words | ~17 min read
java web framework rest services thread queue

In recent years, I have been working for a large, well-established corporation with an extensive IT ecosystem that spans several decades, including various infrastructure, software, and cloud environments, with Java being the prominent language. Maintaining seamless operations and ensuring 24/7 availability of all these systems is an immense challenge.
As site reliability engineer, I have frequently dealt with outages. Although there could be countless reasons for outages, one technical issue that I find particularly bothersome is high load in Java services and how to fail over safely. Especially when there is no ressource shortage at all.
This article is aimed at those who want to improve the reliability of their Java-based web application services and those interested in gaining insights into load testing their services.
Let’s try an experiment together. Take a Web Application Java Framework. Any framework will do. Spring Boot ? Ok.
We’ll stick to a basic “hello world” example without any special configuration, just using plain Spring Boot.
| |
This code is very simple and just returns the string “Hello world”. We can easily perform a performance test on this using the load test tool SlapperX.
This test runs on the same machine as the service and sends 5000 requests per second.

The success rate is 100%, and the result always has a status code of 200. Even with such a high number of requests, the average response time for each request is less than 1ms.
Now, let’s discuss a more realistic situation. Typically, a request involves additional actions like authentication, caching, file system access, database queries, and other backend calls. These actions delay the current request until the result is ready.
It can take anywhere from a few milliseconds to several seconds, depending on the complexity and specific scenarios. In some cases, a request may take up to dozens of seconds to get a response. While this is not ideal for the user, it is generally acceptable. After all, we don’t have the resources of giants like Google or Amazon to optimize every single request to its full potential.
To simulate a blocking action, we can simply add a sleep command to our code.
| |
Now, the “Hello world” response will only be sent after a 1-second delay.
For our performance test, we’ll limit it to 200 requests per second.

The results are what we expected. On average, each request takes exactly 1 second. Additionally, the number of in-flight requests consistently stays around 200. In-flight requests refer to those requests that have been sent but haven’t received a response yet.
Let us make a small change and call the service with 250 requests per second. That is just 50 requests per second more than in the previous example.

It doesn’t look good. Just seconds after starting the calls, the average response time increases significantly. Within a minute, the in-flight requests skyrocket, and the average response time reaches 10 seconds. The load test was set to have a 10-second timeout. No successful requests are made anymore.
We can play around with the parameters, such as increasing the sleep time to 5 seconds.

In this case, the service completely fails in less than 10 seconds. A configured liveness probe would not work anymore and would result in a timeout. Even after stopping the load test, the service remains unusable. Eventually, after several seconds, minutes, or even hours, the service starts to respond normally again.
So far, every Java framework I’ve encountered behaves like this. However, the threshold varies for each framework.
We might have reached a certain limit, but which one? First, let’s check the complete log output of the service during its run:
| |
The log output doesn’t indicate any issues, and there’s nothing in the DEBUG or TRACING log levels either.
Now, let’s examine the server’s hardware metrics: CPU performance, memory usage, and network throughput:
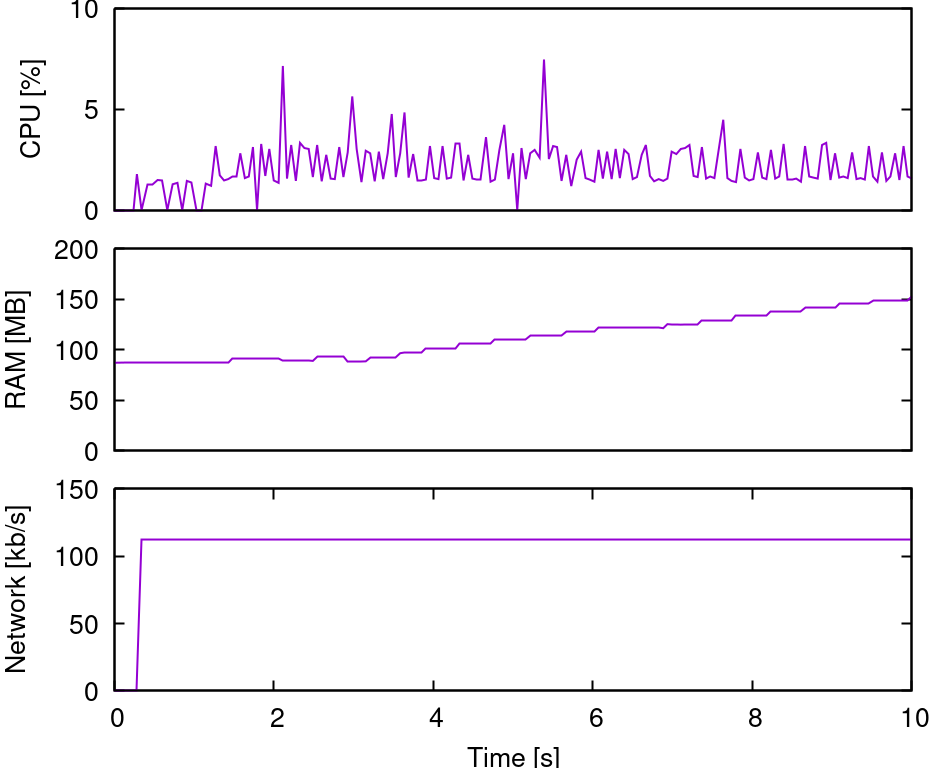
The CPU is idle, network traffic is minimal, and RAM usage is slowly increasing but still low. Clearly, the hardware isn’t causing the problem.
So, what’s taking up time? Let’s look at the tracing output. Every framework allows us to log tracing data, showing how long each request takes:
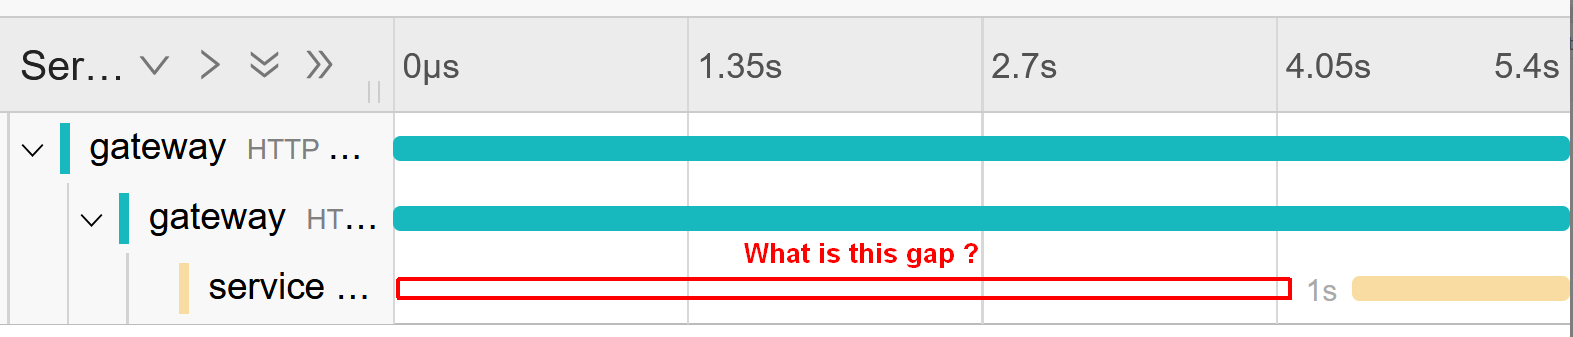
In this tracing output, I’ve added a gateway that also logs tracing data. The service still believes each request takes exactly one second. Only the gateway metrics in relation to the service tracing reveal an issue in the form of a gap in the tracing data.
One final test: let’s measure the actual duration of the request:
| |
The output is
| |
The request consistently takes one second. Even worse, the request number continues to increase even after stopping the load test for several minutes. Calls sent minutes ago are still being processed even if the caller has long disconnected.
To summarize:
We have written a tiny service with a simulated blocking operation and analyzed the response during a high request scenario.
This is the default behaviour of Java microservices under high load conditions!
In real-life situations, such scenarios can arise easily. For instance, a backend system might take a second longer due to maintenance or a malfunctioning node. One problematic backend system can cause your entire service to fail.
But, the problems don’t end there. Users sending requests can also create high load conditions. However, this doesn’t apply to all endpoints. An example is an endpoint with a large return size, like 5MB:
| |
In a test, we request the 5MB output at 10 requests per second. At the 10 second mark, another program is launched to download the 5MB file 200 times at a speed of 0 bytes per second. This second program stops after an additional 10 seconds.

Since the returned value is larger than the internal buffers, the request remains active until the download is complete. The service becomes immediately overwhelmed and unresponsive. Yes, that is all it needs to kill the service. To attack a service and cause a denial of service can be easy.
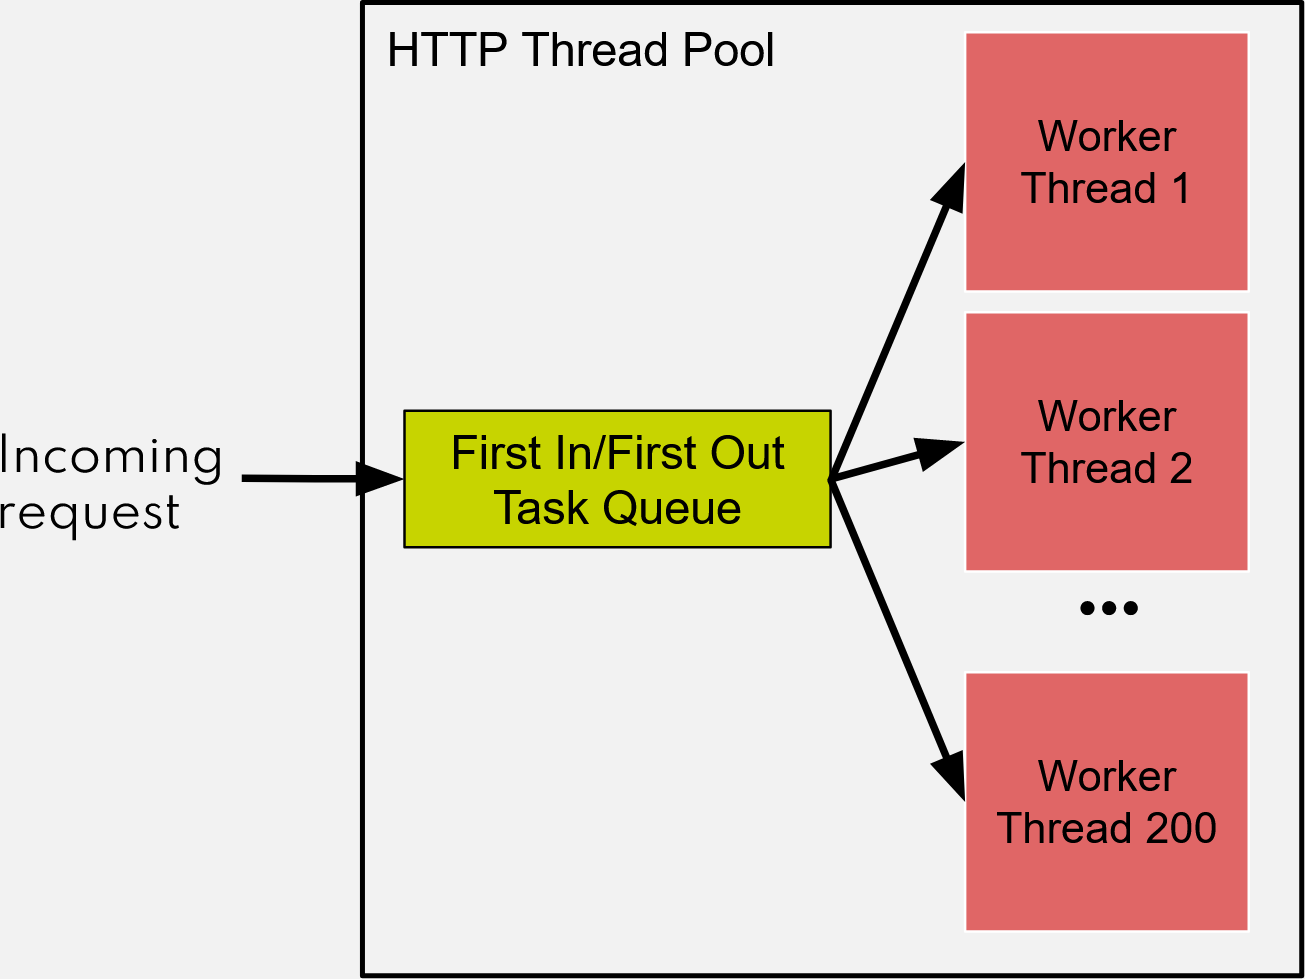
The undesireable behavior occurs due to the way thread pools work in Java. The concept is straightforward and can be seen in this image:
The fixed thread pool documentation states:
| |
Each request uses one worker thread from start to finish. Spring Boot sets the default thread pool size at 200. If the thread pool is full, the task is placed in a first in/first out queue. However, this queue is unbounded, which is the main problem here. Each request could wait a long time in the queue, making the service unusable. The client connection status doesn’t matter at this time as the task is already in the queue and is handled when there is a free worker thread.
So high load in Java Services can be defined as when the maximum number of parallel requests is reached. This is typically not related to CPU, RAM, or network limitations.
Horizontal scaling fixes the high load problems. With tools like Kubernetes, we made it simple: Just add more pods. It works, and your services run well again. However, is using more hardware and throwing money to the problem the real solution?
The solution is straightforward: Either increase worker threads or limit your queue size.
First, let’s consider worker threads. Should we increase their number? Yes, we can do that. However, remember that these threads are managed by the kernel, which is a shared resource and responsible for the stability of your system. Overburdening the kernel with thread organization tasks is not recommended. Have you ever heard of a fork bomb?
Unfortunately, I have not found any information on a reasonable maximum capacity for the kernel. Under laboratory conditions, it can handle 10,000 threads without any problem. However, I am not sure about its capacity in a shared Kubernetes cluster or in a 24/7 scenario. Server operating systems can also impose limits on the maximum number of threads. For example, some Linux server distributions set the default limit to a low number, such as 512.
In any case, it is impossible to predict the optimal number of worker threads for every scenario. This makes it a parameter that we want to eliminate in the long term (see Reactive and Virtual Threads below).
Now let’s consider the queue. Should we limit its size? Yes, definitely. Reasonable values can be found in the book:
In their Queue Management chapter they suggest:
That are reasonable suggestions. Unbounded queues are not mentioned at all. So the best default value is zero or 50% of the thread pool size.
The exact opposite recommendation I’ve come across is in the documentation of the Quarkus framework:
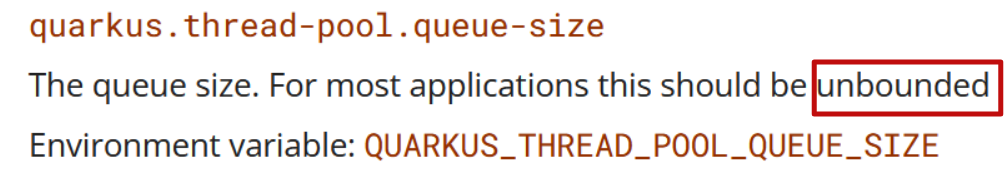
The discrepancy between Site Reliability Engineers and the author of the Java Framework documentation is just 0 vs. infinite. Also no description of the parameter is given.
You might think that web frameworks would have reasonable default settings in place and provide guidance for configuring services for production use. Ideally, every service developer would follow these best practices. Well, the existence of this article suggests that neither is the case.
Here’s what we want to achieve:
Spring Boot provides three parameters for modifying the behavior of the built-in Tomcat server.
You can easily change the number of threads with a property like server.tomcat.threads.max=5000.
However the documentation doesn’t mention the queue. Instead, it offers two alternative parameters:
| |
These parameters can somewhat address high load issues as connections are loosely related to requests and can be controlled by both the client and server.
However, these connection parameters are not appropriate to control the service. A connection can have different meanings based on the protocol and implementation used.
These variants between the implementations and protocols make these connection parameters unpredictable.
Because of the lack to controle the queue I gave this article a developer of Spring Boot for review and as result, a new parameter will be introduced:
| |
Until this parameter is implemented, the lack of control over server internals makes the default server engine in Spring Boot unsuitable for production environments.
But Spring Boot allows using another server instead of Tomcat: Jetty.
Switching to Jetty makes a big difference.

Though the timeout issue still isn’t solved, the server remains usable, and we get a mix of timeouts and successful calls. Jetty’s queue is implemented obviously differently and more reasonably.
We can now change the queue size from unbounded to 1 via the parameter server.jetty.threads.max-queue-capacity=1.

The service no longer allows requests to be queued and remains responsive under all conditions. Additionally, we now see an error in the logs, which makes monitoring easier.
| |
However, the service only responds with an abrupt disconnect, not an error message for the client. This issue cannot be easily fixed in Java and requires a complete change in the internal workings, as explained in the Reactive chapter.
The framework Quarkus has addressed this problem and returns actually an error code when the queue is limited.

The 500 Internal Server Error error code can be changed to a more reasonable 503 Service Unavailable error.
This is probably the best-case scenario for Java services currently. The service remains responsive, and when worker threads are fully occupied, it returns an error code.
But there is more.
Once you understand the behaviour of Java Micro Services under high load you understand the need for circuit breakers in such frameworks.
Circuit breakers monitor error states and contain the logic to prevent future failures. They usually achieve this by not running the problematic code for a certain period of time.
In our case they can be used
In this case, a circuit breaker can be employed when a backend stops responding (Timeout exception). It prevents sending too many requests to an overloaded backend. This way, the backend can recover and function properly again.
However, managing circuit breakers can be challenging. A poorly configured or misunderstood circuit breaker might be even more harmful than not having one at all. The default of a circuit breaker is usually to trigger on every error state unless the status code is 2xx or 3xx.
Here is a small list of possible errors and how to handle them in general if they are dominant in the response statistics.
This short list depicts the difficulty to configure a circuit breaker. Better, the backend server is properly configured and protects itself.
One problem still exists: the limited number of worker threads and the lack of correlation with CPU, RAM, and network usage. Java’s default operating mode uses blocking I/O, which causes the thread to block entirely during an I/O operation. The same goes for the Thread.sleep function.
To manage blocking calls without using kernel threads, a solution is to utilize non-blocking I/O operations provided by operating systems. This approach only blocks one thread for thousands of parallel I/O operations. However, this involves creating an entirely new domain specific language within Java, which is a challenging task that takes years of programming forcing reconsideration of control flow, loops, and exception handling. This is referred to as Reactive programming in the Java world, and several frameworks are available for it.
The example below shows how a “Hello World” program would look in reactive programming:
| |
Using anything outside of the provided dot-syntax can be risky, as it could result in blocking I/O operations. Even an ordinary System.out.println line is problematic, because it could be a blocking I/O operation. Also your entire code must be written in reactive language, and the same goes for all dependencies. The style fights the design of Java and pays a high price in maintainability and observability.
But reactive programming for I/O-driven services will soon be replaced by a new Java feature: Virtual Threads.
Reactive programming is not the only solution to address this issue. For example, the Go programming language has “Goroutines,” which are essentially virtual threads scheduled in user space. These lightweight threads can be parallelized by the millions and do not interfere with the kernel and are only limited by CPU and RAM resources. This eliminates the need to limit the number of threads.
With proper runtime support, there’s no need to change the code you write. A Thread.sleep function used in virtual threads puts the virtual thread to sleep, but not the kernel thread. A win-win situation both for developers and reliability engineers.
This feature is coming soon with Java 21. Framework developers have already pledged their support for virtual threads.
Java remains the top language for Enterprise applications due to its superior ecosystem compared to other programming languages.
However, it still relies on an outdated threading model, which leads to the one-kernel-thread-per-request approach. This works well under normal loads and is easy for frameworks to manage but can be difficult to configure and prone to unexpected failures, as highlighted in this article.
A potential solution to these issues is Virtual Threads, which could help overcome various limitations and simplify the code. The idea of treating parallel running threads like function calls is appealing, but it requires unlearning some long-standing Java programming habits.
In the meantime, while we await the introduction of virtual threads, it’s important to remember one key suggestion:
Limit your request queues!