26. November 2020
by Karl Herzog | 690 words | ~4 min read
software ekg software ecg covid-19 javafx data science data analytics
CW 48: Analyzing COVID-19 data with Software-ECG COVID-19 Edition.
In this series of blogs we are going to look at the current figures of the COVID-19 pandemic with Software ECG. It is a free time series analysis tool originally developed for time series analysis and system analysis of computer problems in distributed systems. With its special COVID-19 edition, QAware has adapted the tool so that the current data from the data hub of the University of Oxford (Our World in Data - OWID) are automatically loaded and immediately available for analysis. More information about Software ECG and download links can be found here:
https://blog.qaware.de/posts/2020-11-11-software-ekg-covid-19-edition/
Note: The German translation for ECG is EKG (Elektrokardiogramm). We are Germans, therefore we use the names “Software ECG” and “Software EKG” as synonyms.
The Software-ECG ist build on Open-JDK and JavaFX. It leverages the power of a compiled language with a native Rich Client Framework.
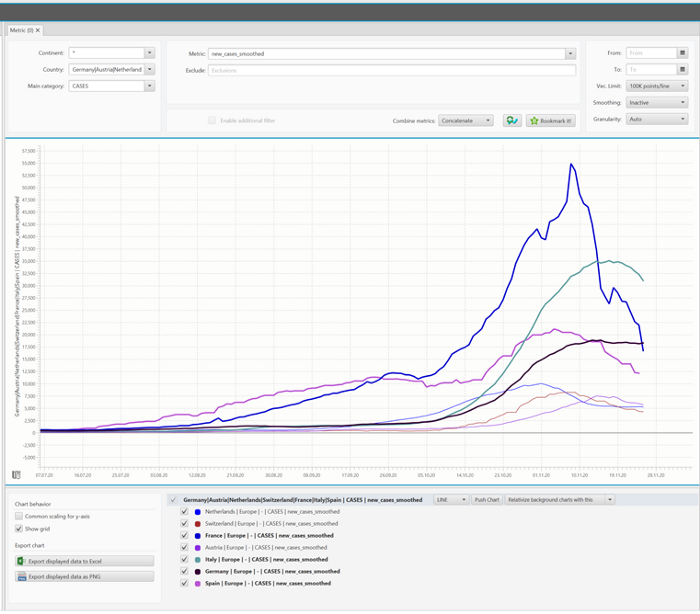
In Europe the number of people who tested positive is now declining. For this purpose, the respective countries can be entered in the selection box using the pipe operator.

The input string in the editable dropdown has the form “country1 | country2 | countryN”. The pipe operator is a logical OR which then selects all the data from country1 to countryN.
As a result, the ECG will show all the countries mentioned. Now you can zoom into the interesting parts using your mouse. Here the selected time is from 07/07/2020 until today (11/25/2020).

#New positive tests per day: Netherlands, Switzerland, France, Austria, Italy, Germany, Spain
The number of positive tests correlates directly with the total number of tests. Dividing the number of positive tests by the total number returns the infection rate. In the COVID-19 data by Our World in Data this metric is called the “positive rate”. You can see it directly in the ECG.
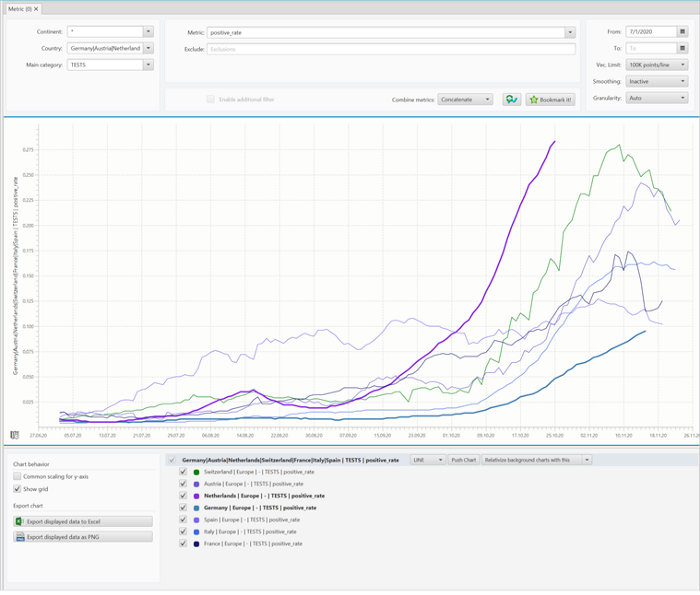
“positive_rate” = number of positive tests / total number of tests
Here the data also show a flattening or breaking of the second wave. Since at the present time data for the Netherlands (purple line) are available only up to 10/25/20 while data for Germany (blue line) are available up to 11/15/20, one cannot make a clear statement here. In next week’s blog we will take another look at the curve and investigate whether the curve is flattening or breaking.
A very useful feature is date selection. The period of time can be set by zooming in or out or by using the date picker in the upper right corner.
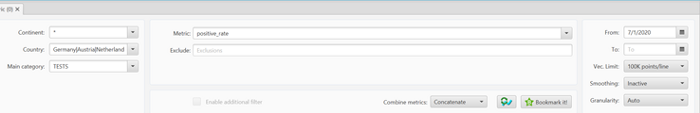
Selection of the positive rate from 7/1/2020 until today
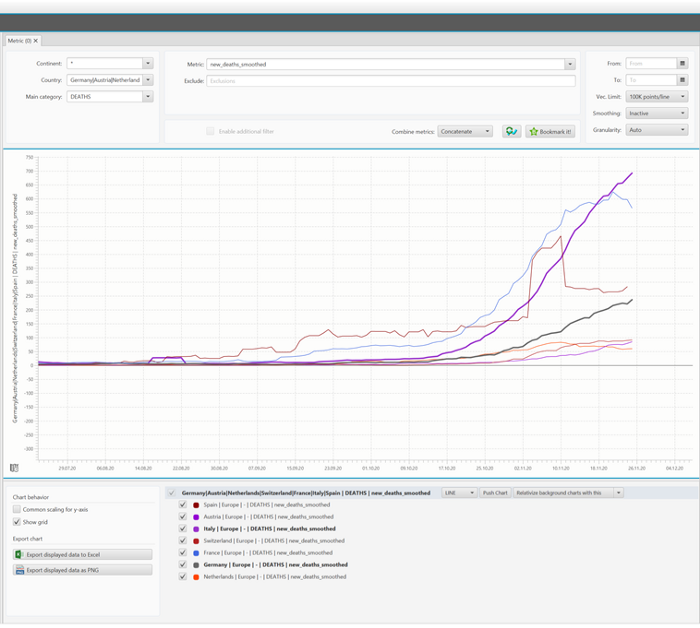
Number of deceased people (second wave)
The number of people who have died of or with COVID-19 is also flattening out in some European countries except for Italy and Germany. It is interesting to note that the death rate in Italy is almost three times as high as in Germany. Please also note the curves are smoothed: This smoothed metric makes a lot of sense, because the curves fluctuate a lot on a daily basis, which has to do not only with statistical and medical reasons but also with organizational reasons of data transfer from laboratories to the authorities. The non-flattened peek values are also available (see new_deaths).
With Software ECG COVID-19 Edition you can evaluate the most important COVID-19 time series across all countries worldwide. The ECG offers the possibility to display several metrics via logical expressions and limit them to certain periods of time. Currently, you can observe the breaking of the second wave in Europe very nicely.
https://ourworldindata.org/coronavirus-source-data
https://blog.qaware.de/posts/2020-11-11-software-ekg-covid-19-edition/
Disclaimer: The tool displays data from the COVID-19 data hub of Our World in Data. The respective countries, authorities and publications are responsible for the data quality. The data collection varies regionally in quality and periods of time. QAware assumes no responsibility for incorrect analysis and conclusions from these data.